 Matt Barber
99.99% sounds great. Until you see what it means at scale:
- About 37 million commercial flights took off in 2024, roughly 100,000 a day. At 99.99%, ten of them wouldn't land safely. Every day.
- Pharmacies in England dispense about 1.16 billion prescription items a year. At 99.99%, more than 300 people a day would get the wrong medicine.
- Your heart beats about 100,000 times a day. At 99.99%, it would miss ten.
- A line making a million parts a week would ship 100 bad ones, every week.
You can't inspect your way to that level of quality. Checking every part is expensive and slow, and when the test destroys the part, it's impossible.
SPC is the alternative. Instead of inspecting everything, you measure a sample at the right frequency and use statistics to show how capable the process is, and whether it's changing. It keeps the number of inspections down while keeping quality high, and it gives you a level of confidence you can trust.
Inspection tells you a part is bad. SPC tells you a part is about to be bad.
That's the other big difference, and it's why statistical process control is one of the most valuable things you can put in front of an operator. Yet in a lot of plants, SPC still means a quality engineer updating a spreadsheet at the end of the week. By then, the scrap is already in the bin.
Specification limits vs control limits
This is the concept people mix up most, so let's align on terminology.
Specification limits come from the customer or engineering. A shaft must be 25.00 mm, ±0.05 mm. Inside the limits is good. Outside is scrap or rework.
Control limits come from the process itself. They're calculated from your own data, typically three standard deviations either side of the average. They show the process's natural variation, so you can tell when something has changed.
A process can be in control and still make scrap, predictably, if its natural spread is wider than the specification or sits too close to one limit. And a process can be entirely within specification while going out of control, drifting steadily towards a limit. That second case is exactly what SPC exists to catch.
Control charts
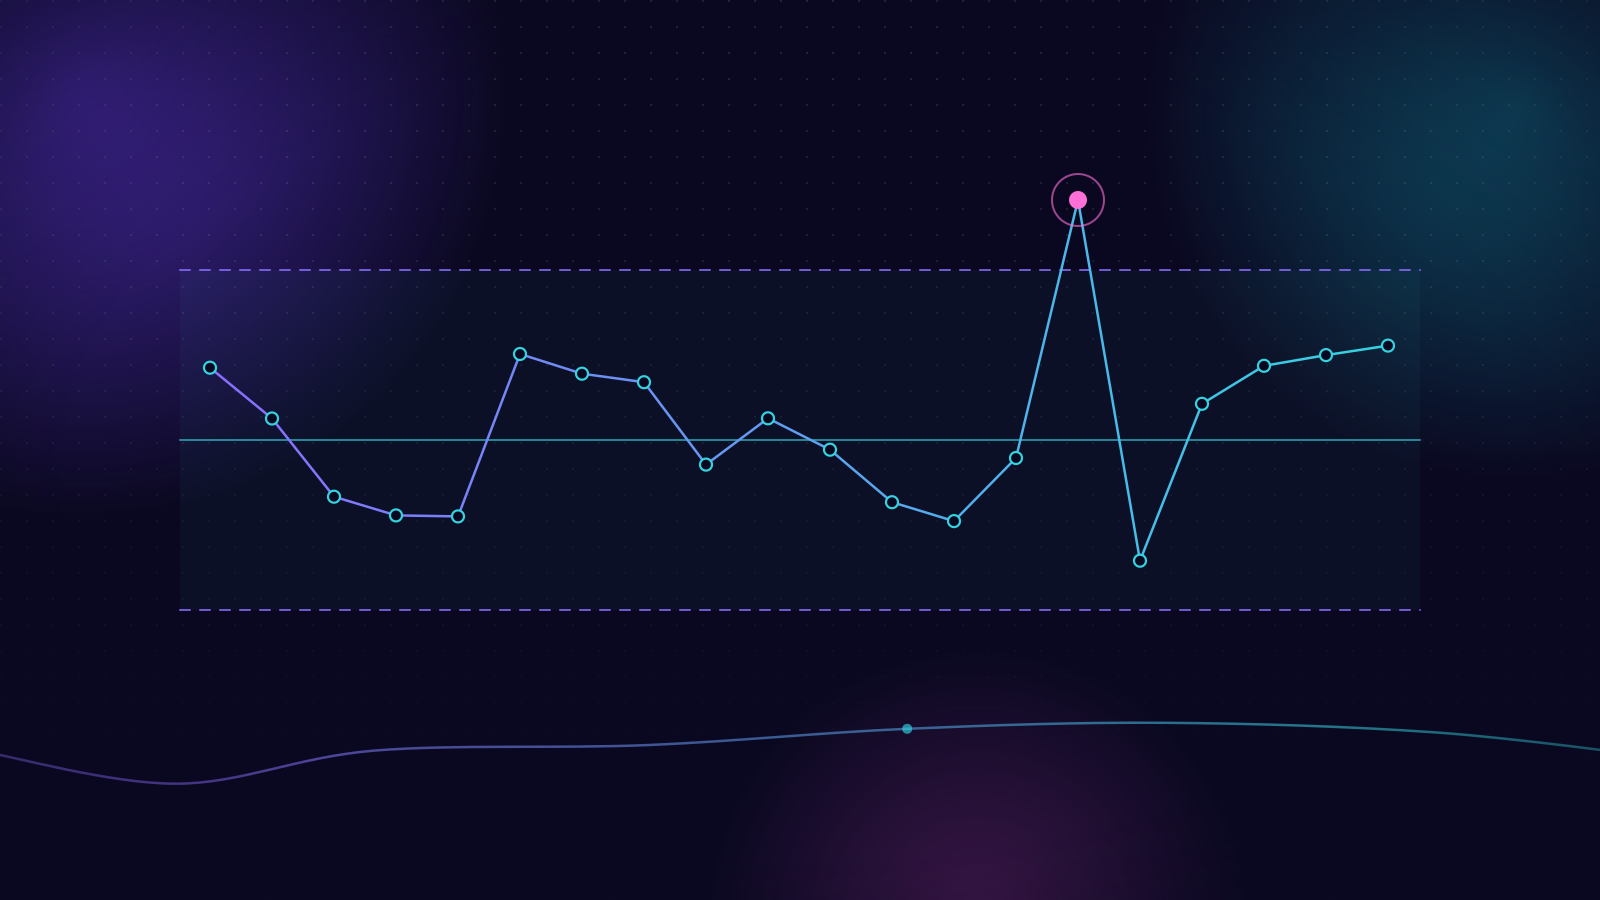
A control chart plots measurements over time, with the average and control limits drawn on. Operators look for points outside the limits, or patterns that shouldn't happen by chance.
For variable data (things you measure, such as length, weight or temperature), the common charts are:
- X-bar and R: averages and ranges of small subgroups, say five parts every hour
- X-bar and S: the same, using standard deviation, for larger subgroups
- I-MR: individual values and moving range, when you only get one measurement at a time, like a batch result
- EWMA or CUSUM: weighted charts that pick up small, slow shifts sooner than the standard charts
For attribute data (things you count), the choice depends on two questions:
The rules that matter
A point outside the control limits is the obvious signal. But patterns inside the limits often tell you more. The ones I'd teach every operator:
- One point beyond the control limits. Something just changed.
- Seven or more points in a row on one side of the average. The process has shifted.
- Six or more points steadily rising or falling. A trend, often tool wear or temperature drift.
- Points hugging the limits, or alternating up and down. Over-adjustment, or two streams mixed together.
Don't switch on every rule. Too many alarms and operators learn to ignore them. Start with a few, then add more where they prove useful.
Capability: Cp, Cpk, Pp and Ppk
Capability compares your process spread with the specification.
- Cp asks: if the process were perfectly centred, would it fit within the specification?
- Cpk asks: given where the process actually sits, does it fit?
Pp and Ppk ask the same two questions, but measure the spread differently.
Cp and Cpk use the variation within subgroups, the short-term spread you'd see in five parts made one after another. That's the process's potential when nothing else moves.
Pp and Ppk use the overall variation across all the data, including the shifts between subgroups: a new lot of material, a different shift, a tool change. That's what the customer actually receives.
| Uses | Tells you | |
|---|---|---|
| Cp | Short-term spread | Potential, if perfectly centred |
| Cpk | Short-term spread and centring | Potential, where the process actually sits |
| Pp | Overall spread | Actual performance, if perfectly centred |
| Ppk | Overall spread and centring | Actual performance, where the process actually sits |
On a stable process, the two sets of numbers are close. If Cpk is much higher than Ppk, the process is moving between subgroups, and that's where to look. Ppk is often used for initial studies of a new process, and Cpk for ongoing production once it's proven stable.
A Cpk of 1.33 is a common minimum for ongoing production. Automotive customers often ask for 1.67 on safety and critical characteristics, and for a Ppk of 1.67 in the initial study before production approval. Check your own customers' requirements; they vary. If your Cp is good but your Cpk is poor, you don't need a better machine. You need to centre the process.
Capability only means something when the process is in control. Calculate it on a process that's all over the place and you'll get a number. It just won't mean anything.
Why SPC belongs in MES/MOM
SPC works when the person who can act on it sees it in time. That's the operator, at the line, during the shift.
Running SPC in MES/MOM gives you things a standalone tool or spreadsheet can't:
- Checks triggered by what's running. The right characteristics for this product, at the right frequency.
- Data from the gauge, not the clipboard. Connected instruments remove transcription errors.
- Context on every point. Order, lot, machine, tool, operator, shift. When the chart shifts, you can see what changed.
- Action, not just alarms. A rule violation can require the operator to record a reason and a corrective action before continuing, or put the lot on hold.
I covered inspection plans and quality operations in MES functionality: quality operations. SPC is the part that turns those inspections from a pass/fail record into an early warning.
Closing the loop
SPC data is gold upstream too. Engineering wants to know which characteristics are hard to hold, so they can rethink tolerances or design. Quality wants trends across sites, in MOM or in a QMS where one is used. Where critical characteristics are defined in PLM, sending the capability results back closes the digital thread.
Here's a question to take to your next quality review: of last month's scrap, how much showed up as a trend on a control chart first, and nobody acted on it?